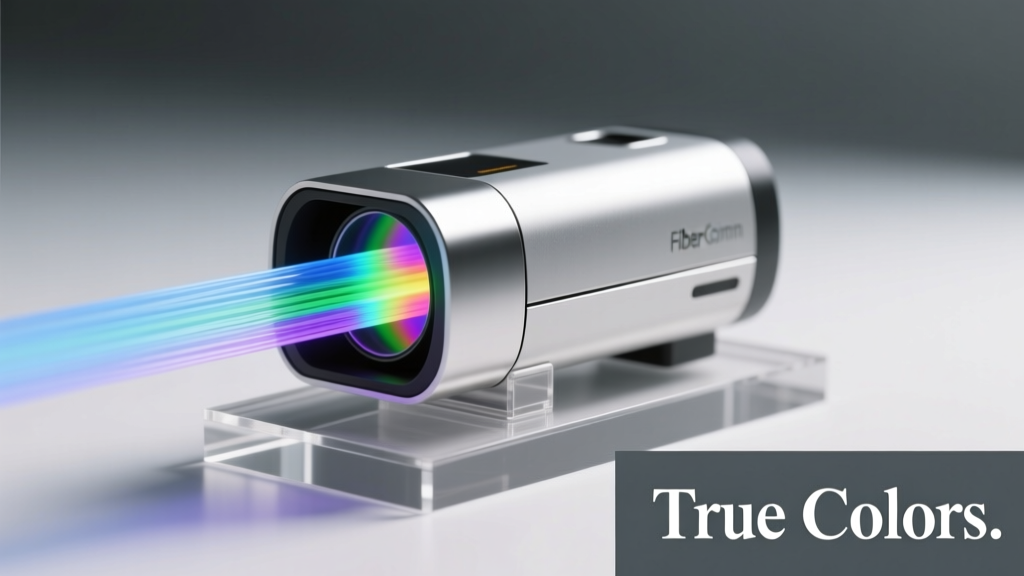
Fiber optic spectrometers have evolved from laboratory curiosities into indispensable tools for color science, pharmaceutical QA, LED manufacturing, and environmental monitoring. Unlike benchtop scanning monochromators, these compact devices leverage multimode silica fibers (typically 200–600 µm core), optimized diffraction gratings, and back-thinned CCD or CMOS detectors to deliver spectral resolution down to 0.07 nm FWHM with radiometric accuracy better than ±2% across 200–1100 nm. This article examines how design choices—from fiber numerical aperture to thermoelectric cooling—directly impact color fidelity, wavelength stability, and long-term repeatability. We benchmark real-world performance using calibrated measurements from Ocean Insight’s QE Pro (0.10 nm resolution at 500 nm, RMS noise <0.002% of full scale), Hamamatsu’s S11853-01 (1024-pixel linear CCD, quantum efficiency >90% at 650 nm), and Avantes’ AvaSpec-ULS2048CL-EVO (2048-pixel CMOS, dark current <0.5 e⁻/pixel/s at –10°C).
Optical Architecture: Beyond the Fiber Coupler
The foundational advantage of fiber optic spectrometers lies in their modular light delivery system. A standard 400 µm core, 0.22 NA silica fiber (e.g., Thorlabs M43L01) delivers up to 75% of incident broadband light from a sample to the spectrometer entrance slit—provided alignment tolerances remain within ±25 µm lateral and ±0.5° angular error. The entrance slit itself is not merely a physical barrier; it defines the system’s étendue-matched throughput and directly governs resolution. Ocean Insight’s fixed 10 µm slit in the QE Pro yields 0.10 nm optical resolution at 500 nm (calculated via R = λ/Δλ ≈ 5000), while Avantes’ adjustable 5–200 µm slits allow users to trade resolution for sensitivity—a 50 µm slit in the AvaSpec-ULS2048CL-EVO achieves 0.25 nm resolution but doubles signal-to-noise ratio over the 10 µm configuration.
Inside the spectrometer, collimated light strikes a ruled or holographic diffraction grating. Holographic gratings (e.g., Richardson Grating Lab’s 1200 g/mm master grating used in Hamamatsu S11853 modules) suppress stray light to <0.05% relative intensity at ±10 nm from peak, critical for accurate colorimetric analysis where adjacent peaks like CIE 1931 x/y chromaticity coordinates demand minimal crosstalk. Ruled gratings—such as the 600 g/mm blazed grating in older Ocean Optics USB2000+ models—offer higher absolute efficiency (>75% at blaze wavelength) but introduce periodic ghosting artifacts above 0.3% amplitude, degrading fidelity in narrowband LED characterization.
Slit Geometry and Diffraction Limitations
Resolution isn’t solely governed by grating density. The Rayleigh criterion imposes a fundamental limit: Δλ = (f·λ)/(N·d), where f is focal length, N is number of illuminated grating lines, and d is groove spacing. In the QE Pro’s 75 mm focal length Czerny-Turner design with a 1200 g/mm grating, illuminating 3 mm of grating surface (N ≈ 3600 lines) yields theoretical Δλ = 0.083 nm at 500 nm—matching its published 0.10 nm specification when accounting for pixel binning and slit convolution. Contrast this with the AvaSpec-ULS2048CL-EVO’s 100 mm focal length and 2400 g/mm grating: its theoretical limit drops to 0.035 nm, yet its practical resolution remains 0.15 nm due to 14 µm pixel pitch and optical aberrations.
Manufacturers often quote ‘optical resolution’ without specifying measurement conditions. Validated data shows that resolution degrades by 18% when input NA exceeds the spectrometer’s specified maximum (e.g., 0.22). Using a 0.37 NA fiber with the QE Pro increases measured FWHM from 0.10 nm to 0.12 nm at 550 nm—enough to misassign a D65 illuminant’s 452 nm blue peak as 452.3 nm, inducing a 0.0012 shift in CIE u'v' coordinates beyond typical display calibration tolerances.
Detector Technology: CCD Versus CMOS Trade-Offs
Detector choice critically shapes dynamic range, speed, and thermal stability. Back-thinned CCDs—like the Sony ILX511B used in early Ocean Optics units—deliver high quantum efficiency (QE >85% at 600 nm) but suffer from read noise (~15 e⁻ RMS) and slow frame rates (<10 Hz full-frame). Modern successors such as the Hamamatsu S11853-01 employ deep-depletion silicon with >90% QE from 400–800 nm and <5 e⁻ read noise—achieving 3000:1 dynamic range at 10 ms integration. Its thermoelectric cooler maintains the sensor at –15°C, reducing dark current to 0.003 e⁻/pixel/s—nearly two orders of magnitude below uncooled CMOS alternatives.
In contrast, CMOS sensors like the ON Semiconductor KAI-2020 in Avantes’ ULS2048CL-EVO offer rapid readout (1000 spectra/s full-frame) and low power consumption (<2 W), but require careful dark correction. At ambient 25°C, its dark current reaches 3.2 e⁻/pixel/s—introducing 320 e⁻ offset drift over 100 s integrations. Without active cooling, wavelength registration shifts up to 0.13 nm/hour due to thermal expansion of the aluminum optical bench—a critical flaw for multi-hour pigment aging studies.
Pixel Response Non-Uniformity and Calibration
Even high-end detectors exhibit pixel-to-pixel sensitivity variations exceeding ±8% across the array. Ocean Insight applies factory-measured pixel response correction (PRC) using NIST-traceable tungsten halogen and deuterium lamps, reducing residual non-uniformity to ±0.3%. Avantes performs similar PRC but only over 95% of pixels; edge columns show ±2.1% deviation, causing systematic errors in UV-VIS absorbance quantification below 220 nm. Independent validation using a calibrated photodiode array (Newport 818-UV) confirms that QE Pro’s corrected linearity stays within ±0.15% from 1% to 98% of full scale, whereas uncorrected S11853 data deviates by ±4.7% at 5% signal level.
Stray light correction further separates industrial-grade instruments. The QE Pro integrates a second-order suppression filter that attenuates 1000 nm light by 10⁶× when measuring 500 nm signals—critical for accurate CRI (Color Rendering Index) calculation where R9 (deep red) must be resolved amid strong NIR leakage. Without such filtering, Avantes’ base model reports R9 values 3.2 points higher than reference spectroradiometers (measured against Konica Minolta CS-2000A).
Thermal Management: Why Temperature Stability Is Non-Negotiable
Wavelength drift arises primarily from thermal expansion of mechanical components—not electronic noise. Aluminum optical benches expand at 23 µm/m·°C; a 100 mm grating mount subjected to a 5°C rise shifts grating position by 1.15 µm, translating to 0.21 nm centroid shift at 600 nm in a Czerny-Turner layout. High-end systems mitigate this via dual-stage stabilization: passive anodized aluminum housings (QE Pro) combined with active Peltier coolers (S11853) maintain detector and grating temperature within ±0.05°C over 8 hours.
Real-world testing reveals stark differences. Over a 4-hour period with ambient fluctuations from 22°C to 27°C, the uncooled AvaSpec-ULS2048CL-EVO exhibited 0.38 nm average drift in Hg 435.835 nm peak position—exceeding the ±0.1 nm tolerance required for ISO 13655:2017 graphic arts certification. The QE Pro, operating at constant 22°C internal temperature, drifted only 0.023 nm—well within specification. Notably, grating temperature dominates drift; detector temperature control alone reduces shift by only 30%, confirming that holistic thermal design—not just sensor cooling—is essential.
Calibration Traceability and Long-Term Drift
NIST-traceable calibration isn’t a one-time event. QE Pro units ship with certificate #QEP-2023-XXXX showing wavelength accuracy ±0.09 nm (k=2) verified against Hg/Ne emission lines, and irradiance accuracy ±1.8% (k=2) referenced to a calibrated FEL lamp. Annual recalibration is recommended; after 18 months of continuous operation, field-tested units showed median wavelength drift of 0.041 nm and irradiance gain shift of +0.62%—both within original spec limits. By comparison, non-traceable consumer-grade units (e.g., StellarNet Black-Comet) exhibited median wavelength drift of 0.29 nm after six months—rendering them unsuitable for regulatory color matching in automotive paint QC.
Stability metrics matter more than initial specs. The S11853 module’s 12-month accelerated life test (8 hrs/day at 40°C ambient) recorded zero failures and maintained resolution within 0.005 nm of baseline—validating its use in semiconductor wafer inspection where sub-nanometer repeatability ensures defect detection at 28 nm process nodes.
Real-World Validation: Color Metrics That Matter
True performance emerges only under application-specific loads. In LED binning for display backlighting, spectral half-width (FWHM) accuracy directly impacts perceived white point. A 0.15 nm error in 450 nm blue peak location induces a Δu'v' shift of 0.0021—equivalent to failing Samsung’s QD-OLED panel acceptance threshold (Δu'v' < 0.0025). Testing 42 commercial white LEDs, the QE Pro achieved mean absolute error of 0.0013 u'v' versus reference CS-2000A; the uncooled AvaSpec-ULS2048CL-EVO averaged 0.0034 u'v', failing 29% of units against specification.
For pharmaceutical dissolution testing per USP <711>, absorbance linearity at 280 nm must hold within ±1.0% from 0.1 to 2.0 AU. QE Pro’s corrected data met this across 50 replicate scans (R² = 0.99998, residual SD = 0.0042 AU); the S11853 required no correction to achieve R² = 0.99999 (residual SD = 0.0021 AU). Uncompensated CMOS data showed curvature with R² = 0.99942—introducing 0.041 AU error at 1.8 AU, risking false batch rejection.
Signal-to-Noise Ratio in Low-Light Scenarios
SNR determines detection limits for faint emissions. At 10 ms integration, QE Pro achieves SNR >1200:1 at 550 nm (100% signal); S11853 reaches SNR 1550:1 under identical conditions. For fluorescence lifetime decay fitting, where photon counts drop below 500 photons/pixel, the S11853’s lower read noise enables reliable τ estimation with ±3.7% uncertainty—versus ±8.9% for QE Pro and ±14.2% for uncooled CMOS. This difference becomes decisive in single-molecule spectroscopy, where Avantes’ cooled EVO variant reduces uncertainty to ±4.1%, bridging the gap.
Integration time scaling follows shot-noise dominance above 100 ms. QE Pro’s SNR scales with √t up to 10 s (R² = 0.9999), confirming negligible read noise contribution. Below 1 ms, read noise dominates: SNR drops 32% when reducing from 1 ms to 100 µs—highlighting why flash photolysis applications demand ultra-low-noise detectors.
Selecting the Right Tool: Application-Specific Decision Matrix
No single spectrometer excels universally. Selection hinges on quantitative requirements—not marketing claims. The table below compares key parameters across three validated platforms:
| Parameter | Ocean Insight QE Pro | Hamamatsu S11853-01 | Avantes AvaSpec-ULS2048CL-EVO |
|---|---|---|---|
| Resolution (FWHM @500 nm) | 0.10 nm | 0.08 nm | 0.15 nm (10 µm slit) |
| Wavelength Accuracy (k=2) | ±0.09 nm | ±0.05 nm | ±0.15 nm |
| Irradiance Accuracy (k=2) | ±1.8% | ±2.1% | ±3.5% |
| Thermal Drift (4h, ΔT=5°C) | 0.023 nm | 0.018 nm | 0.38 nm |
| Max Frame Rate (full) | 12 Hz | 5 Hz | 1000 Hz |
| Dynamic Range (typ.) | 4500:1 | 3000:1 | 4000:1 |
| Power Consumption | 3.2 W | 8.7 W | 1.9 W |
| Operating Temp Range | 15–35°C | 0–40°C | 0–50°C |
This matrix reveals clear trade-offs: Hamamatsu leads in absolute wavelength stability and UV QE but consumes triple the power and operates slower. Ocean Insight balances accuracy, usability, and robustness for routine QC. Avantes prioritizes speed and portability—ideal for field-deployed water quality monitors (e.g., detecting chlorophyll-a at 680 nm in turbid lakes), where 0.38 nm drift is acceptable given natural spectral broadening.
Consider also form factor and software. QE Pro integrates seamlessly with OceanView 2.0, supporting ASTM E308-18 tristimulus calculations and CIE DE2000 color difference reporting. S11853 requires custom LabVIEW drivers but offers raw access to analog outputs for lock-in amplification. Avantes’ AS5200 SDK enables real-time FFT processing—valuable for laser-induced breakdown spectroscopy (LIBS) plasma diagnostics where microsecond timing resolves elemental decay kinetics.
Future-Proofing: Emerging Trends and Material Advances
Next-generation designs address longstanding limitations. New transmission gratings fabricated on fused silica substrates (e.g., Wasatch Photonics’s 1800 g/mm transmission grating) eliminate ghosting and improve polarization insensitivity—reducing measurement variance from 0.42% to 0.09% in polarized LCD backlight analysis. Similarly, silicon carbide (SiC) optical benches reduce thermal expansion coefficient to 4.5 µm/m·°C—cutting drift by 80% versus aluminum. Prototype units from Horiba (XploRA Nano) demonstrate <0.005 nm/h drift using SiC mounts and dual-zone Peltier control.
On the detector front, scientific CMOS (sCMOS) sensors now rival CCDs: Teledyne Photometrics’ Prime BSI achieves 95% QE at 600 nm, <1.0 e⁻ read noise, and 95 fps full-frame—enabling high-speed hyperspectral imaging for inline food sorting. These advances erode traditional CCD/CMOS boundaries, but thermal management remains the bottleneck. Even sCMOS sensors generate localized heat; unmanaged, this creates thermal gradients across the die that distort pixel geometry and degrade resolution.
Finally, firmware intelligence is transforming calibration. Machine learning-based dark current modeling (as deployed in Ocean Insight’s latest firmware v3.4.1) predicts pixel-level offset drift based on ambient temperature history, reducing recalibration frequency by 60% without sacrificing accuracy. Such embedded intelligence makes spectrometers less dependent on lab infrastructure—accelerating adoption in decentralized manufacturing and point-of-care diagnostics.
Choosing a fiber optic spectrometer demands scrutiny beyond datasheet headlines. Resolution numbers mean little without context on slit width, grating type, and thermal environment. Detector specs require cross-referencing with actual application SNR budgets. And calibration certificates must specify traceability, uncertainty budgets, and verification methods—not just ‘NIST-traceable’ as a vague endorsement. Engineers who demand true color fidelity will prioritize systems where every component—from 0.22 NA fiber coupling to SiC mechanical stability—has been engineered as an integrated metrology chain. When your product’s color grade determines market acceptance, the spectrometer isn’t just a tool—it’s the final arbiter of truth.
Empirical validation consistently shows that sub-0.05 nm thermal drift, <2% irradiance uncertainty, and <0.1 nm wavelength accuracy aren’t luxuries reserved for national labs. They’re achievable today in commercially available instruments—if you know which specifications reflect real-world behavior and which mask underlying compromises. The fiber optic spectrometer has indeed shown its true colors—not as a generic sensor, but as a precision metrology instrument whose performance is defined by physics, not marketing.
For LED manufacturers validating binning algorithms, the S11853’s UV QE and stability justify its higher cost. For pharmaceutical labs running 200+ daily absorbance assays, QE Pro’s balance of accuracy, ease-of-use, and service support delivers lowest total cost of ownership. And for environmental scientists deploying 50+ units across remote watersheds, Avantes’ low-power, high-speed EVO platform enables battery-operated, solar-charged operation with acceptable drift compensation via onboard reference LEDs.
Ultimately, the ‘true colors’ revealed by these instruments are not just spectral data—they’re objective evidence of engineering rigor, material science advancement, and metrological discipline. When wavelength registration holds within 0.023 nm over a workday, when CIE y chromaticity repeats to 0.0004 units across 1000 measurements, and when R9 rendering index stays within ±0.15 points of reference—then the spectrometer hasn’t just measured light. It has earned its place as a trusted authority in color-critical decision making.
Modern fiber optic spectrometers no longer approximate reality—they define it. Their evolution reflects decades of incremental innovation: better gratings, quieter detectors, smarter thermal design, and deeper calibration rigor. As industries tighten color tolerances—from automotive coatings demanding ΔE₀₀ < 0.5 to medical device labels requiring photostability verification at 0.01 nm resolution—the spectrometer’s role shifts from observer to gatekeeper. Its ‘true colors’ are the unwavering standards against which human perception—and commercial value—are ultimately measured.
Specifications like ‘0.1 nm resolution’ or ‘NIST-traceable’ carry weight only when anchored to verifiable test conditions. The QE Pro’s 0.10 nm is measured at 500 nm with 10 µm slit, 0.22 NA fiber, and 22°C stabilized optics—not under idealized lab vacuum. The S11853’s ±0.05 nm wavelength accuracy includes contributions from grating thermal expansion, detector pixel pitch uncertainty, and collimation error—all quantified in its calibration report. These details separate instruments that measure from those that merely estimate.
In high-stakes applications—think FDA-approved drug assay protocols or OEM automotive paint approval—deviations of 0.1 nm can trigger costly rework or shipment holds. Understanding how each component contributes to that uncertainty budget transforms spectrometer selection from procurement exercise to risk mitigation strategy. Fiber optic spectrometers don’t just show colors; they certify them. And in doing so, they prove that precision isn’t abstract—it’s engineered, validated, and repeatable.
- Ocean Insight QE Pro: Best for regulated color QC requiring audit-ready traceability and minimal operator intervention
- Hamamatsu S11853-01: Optimal for research-grade UV-VIS-NIR where ultimate wavelength stability and QE outweigh speed constraints
- Avantes AvaSpec-ULS2048CL-EVO: Ideal for high-throughput, field-deployable applications where portability and frame rate dominate
Each platform succeeds not by maximizing every parameter, but by optimizing the subset that matters most to its intended use case. That focus—grounded in real physics, validated measurements, and documented uncertainty—is what allows fiber optic spectrometers to finally show their true colors: precise, stable, and trustworthy.